

The Content Report collects data from the interactive content used in emails and meetings
In order to see this report, first go to the backend at editor.prezentor.com, followed by "Reports" in the navigation bar at the top, and then press "Content view" in the drop-down box that appears.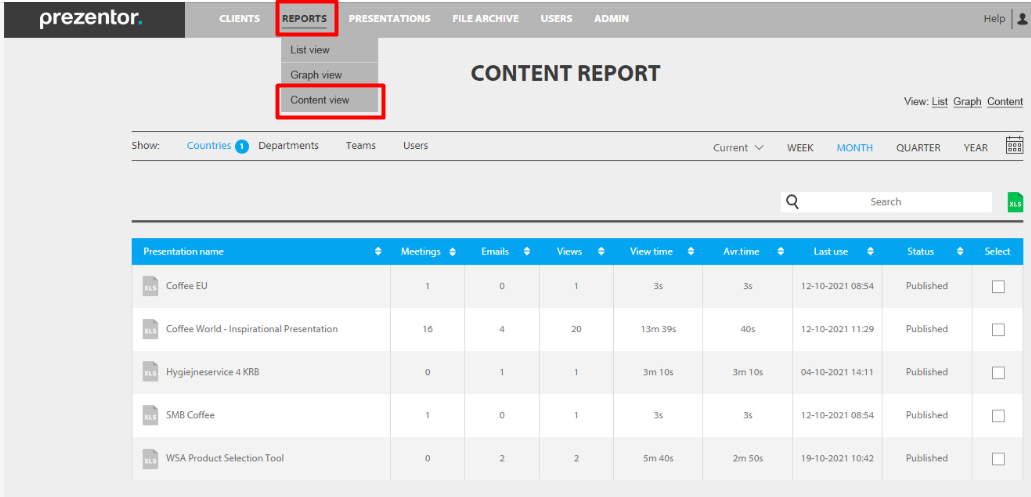
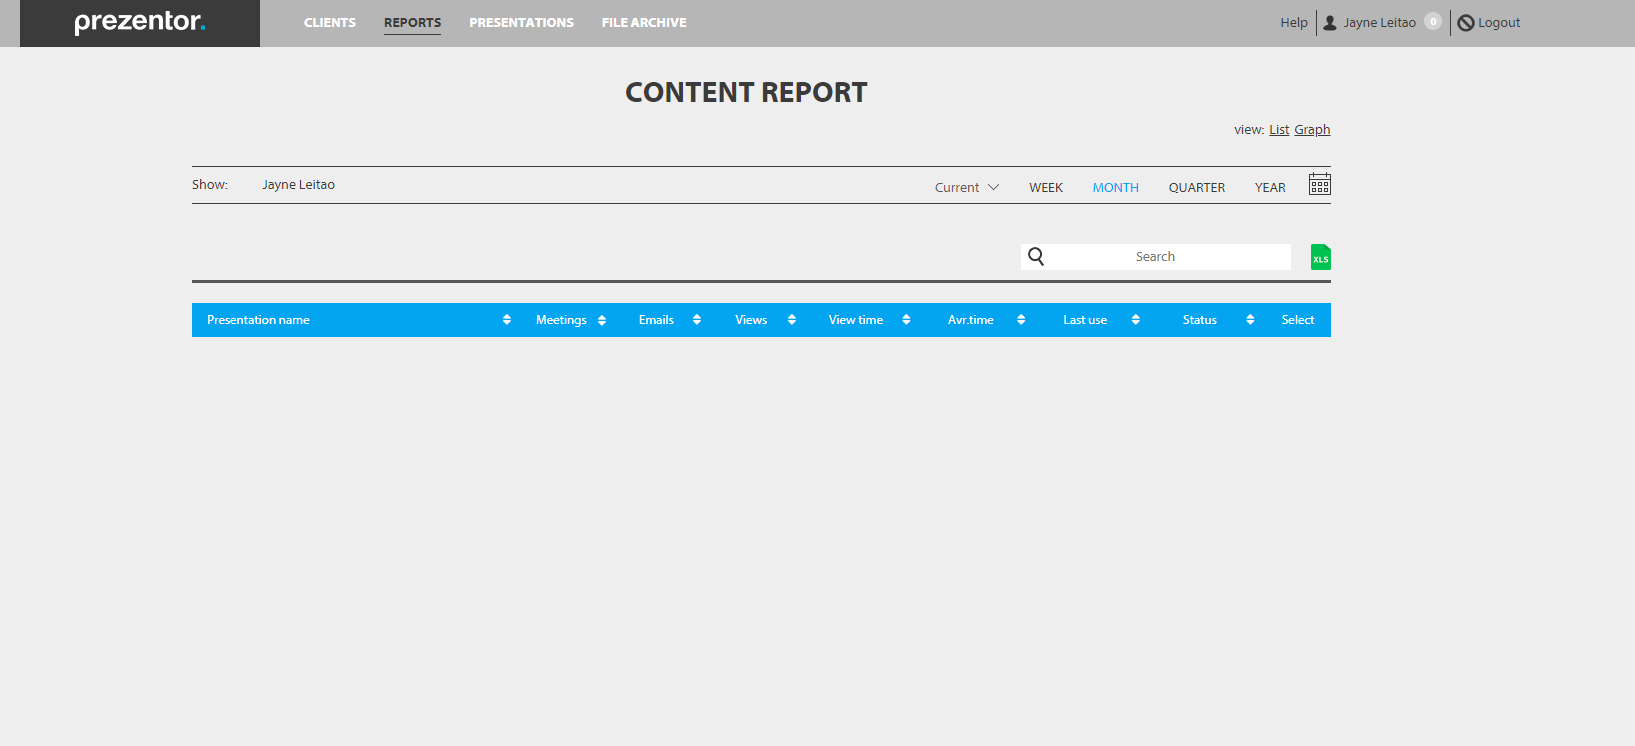
If it is your first time using the reports, you will likely get a blank screen like this.
To generate your first report, navigate to the presentation you wish to see the report for, click on the slide, click on a widget that contains data - such a slider, checkbox, text input etc. - and then click "Advanced"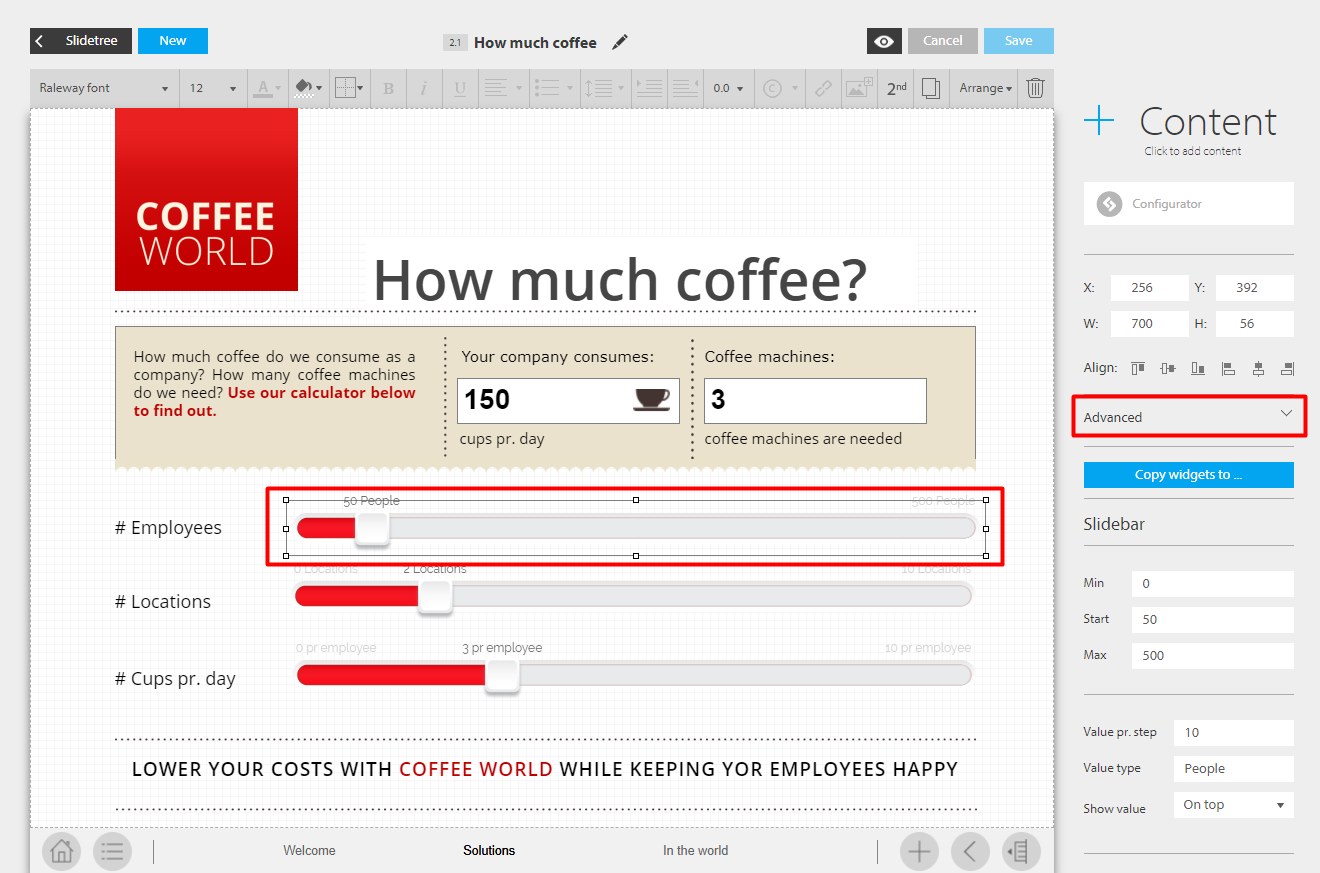
Here, you'll be able to toggle the "Show in report" box, as well as write a label for this widget so you know what is being referred to in the report. When done, press "Save."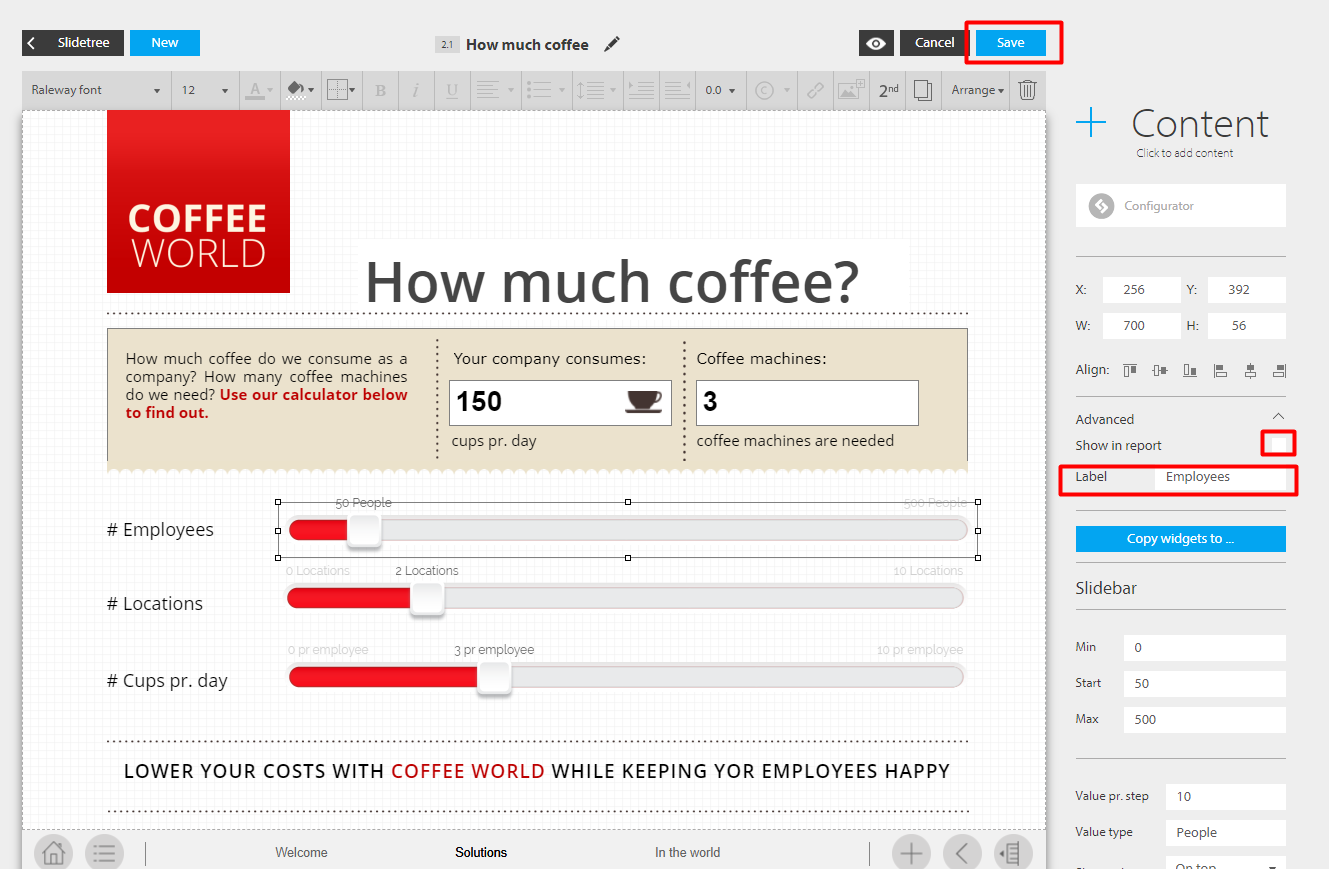
Move through your presentation slides and content to decide which content is relevant for your report.
When you head back to the "Reports" section, you'll be able to choose which timeframe you'd like to look at, and which country, department or team, is relevant. Else, you'll get a full overview of all presentations with selected widgets.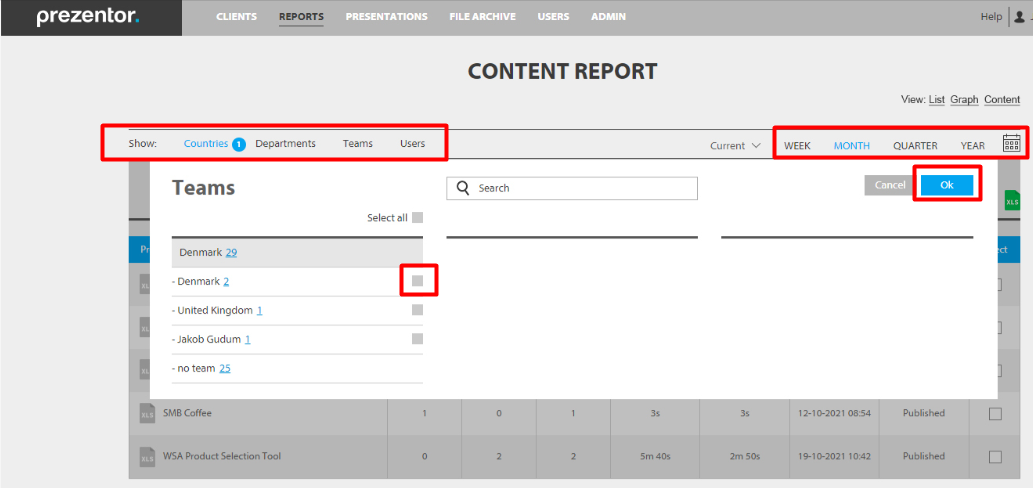
Select the presentation or presentations you'd like to look at, then press the "XLS" button to generate the Excel reports.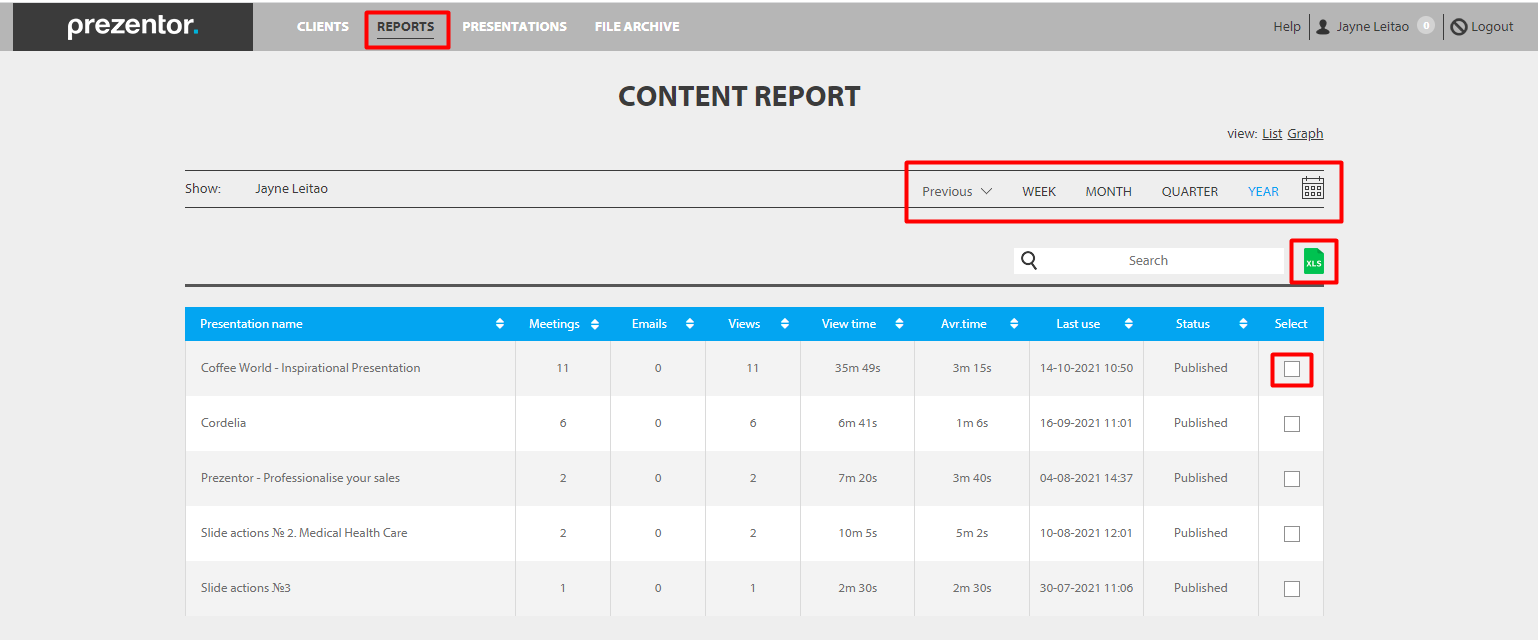
If you choose multiple presentations, you will be able to compare them in a single file.
If you choose a single file, you will see only the report for this content.
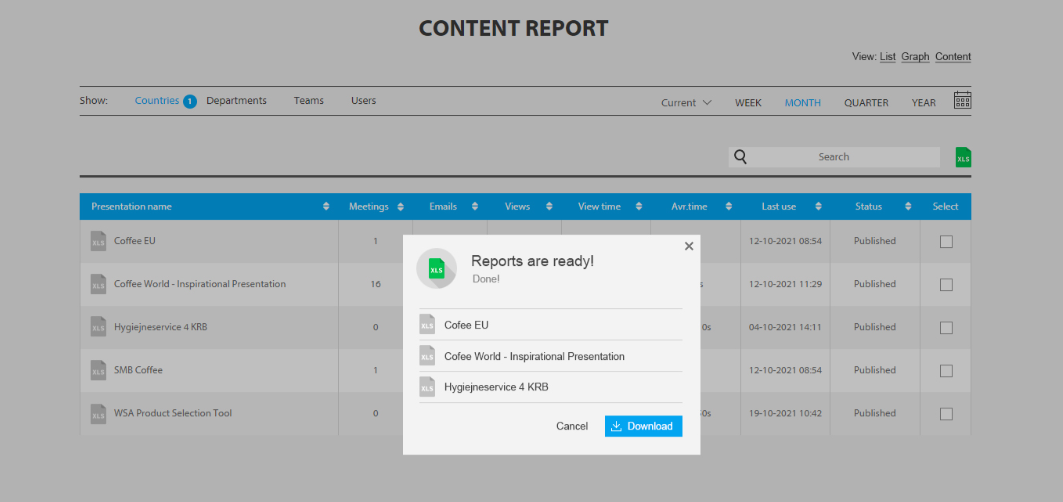
Once pressing the "XLS" button, you'll receive a pop-up box, where you can then press "Download" to view the Excel report.
Watch the following tutorial for a step-by-step guide of the above process:
If you need further help on understanding the report, please contact our support team.
Comments
0 comments
Article is closed for comments.